Data Walking, A research project exploring data gathering & data visualisation, Ravensbourne Research Office, London, UK
Data Walking is a research project exploring the potential of walking to gather environmental data and through multiple walks and visualisations build a rich picture of that area. The project examines technology and tools for creative data gathering and experimenting with data visualisation, to create tools, gain insight, and share knowledge. The project has been through a series of distinct inital phases and resulted in a number of international workshops and presentations at events and conferences. There have been a variety of outcomes from data sculptures to printed publications. The North Greenwich phase resulted in a 96 page report featuring the visualisations of renowned designers, studios, educators and students, as well as practical advice on beginning your own walks or workshops, and tools to try out.
Year: 2018
Client: Ravensbourne Research Office
Project by: David Hunter
Production: Aspect Press
Collaborators: Non-Verbal Club, João Novais
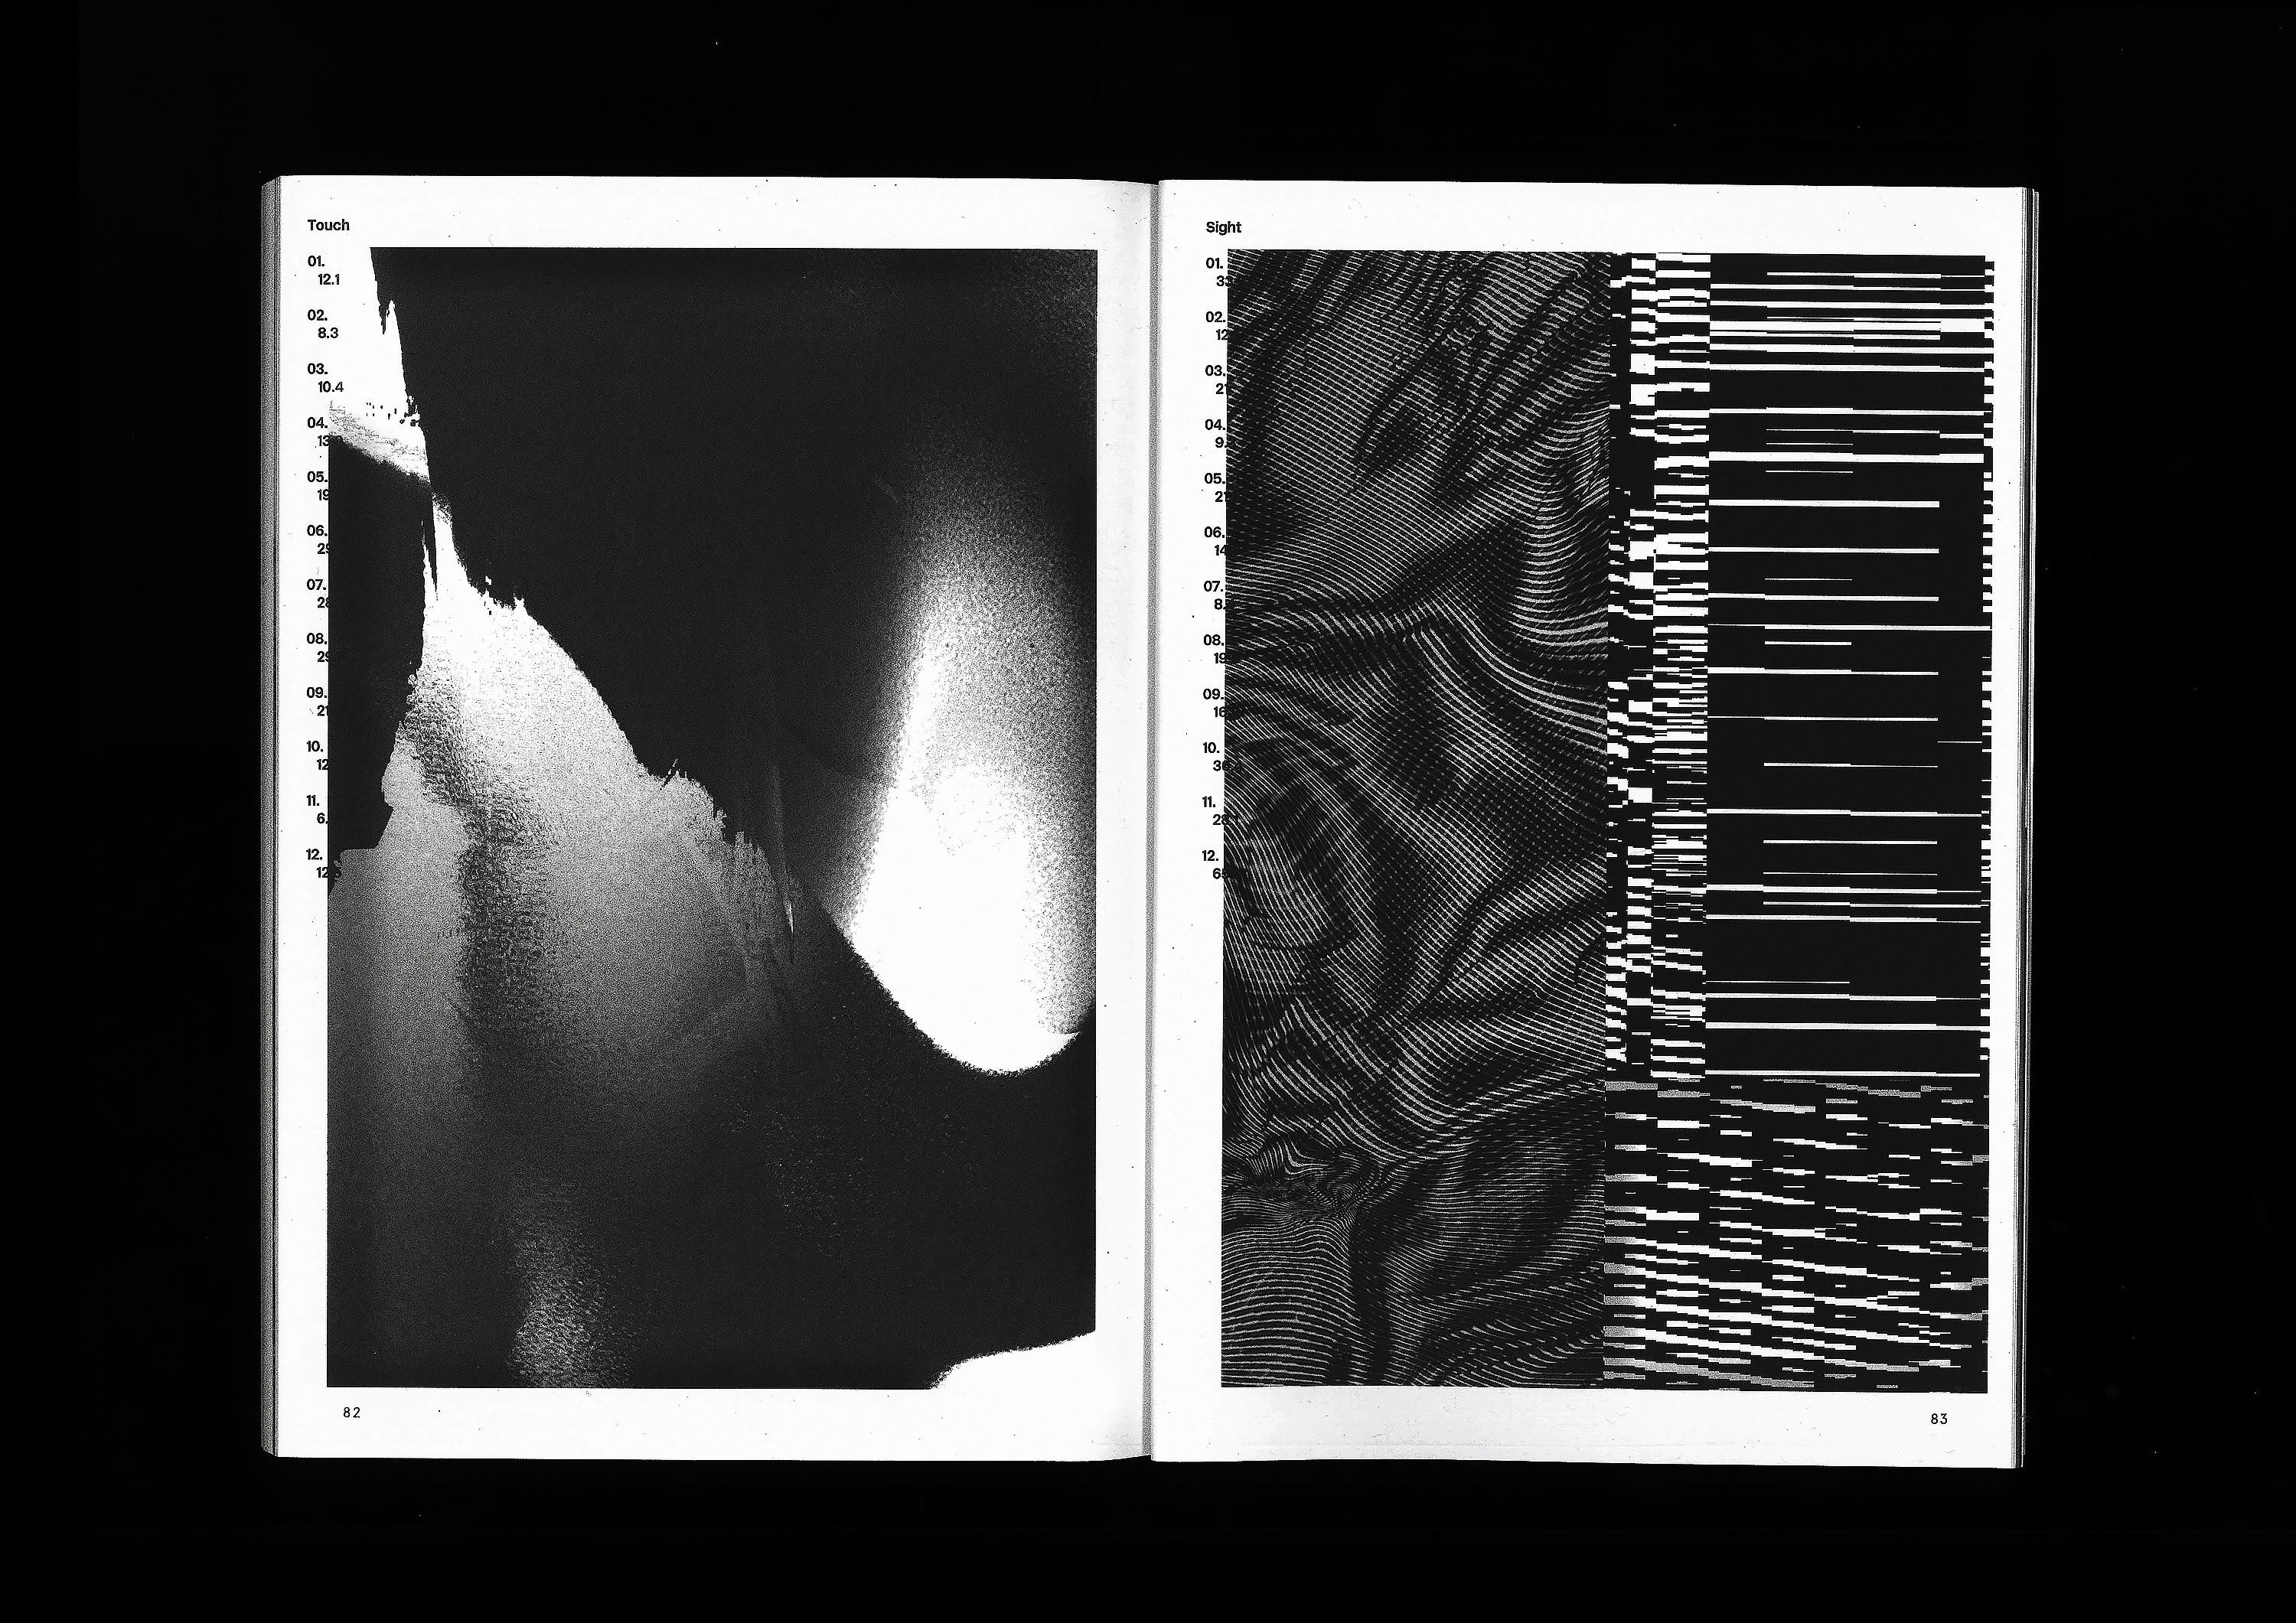
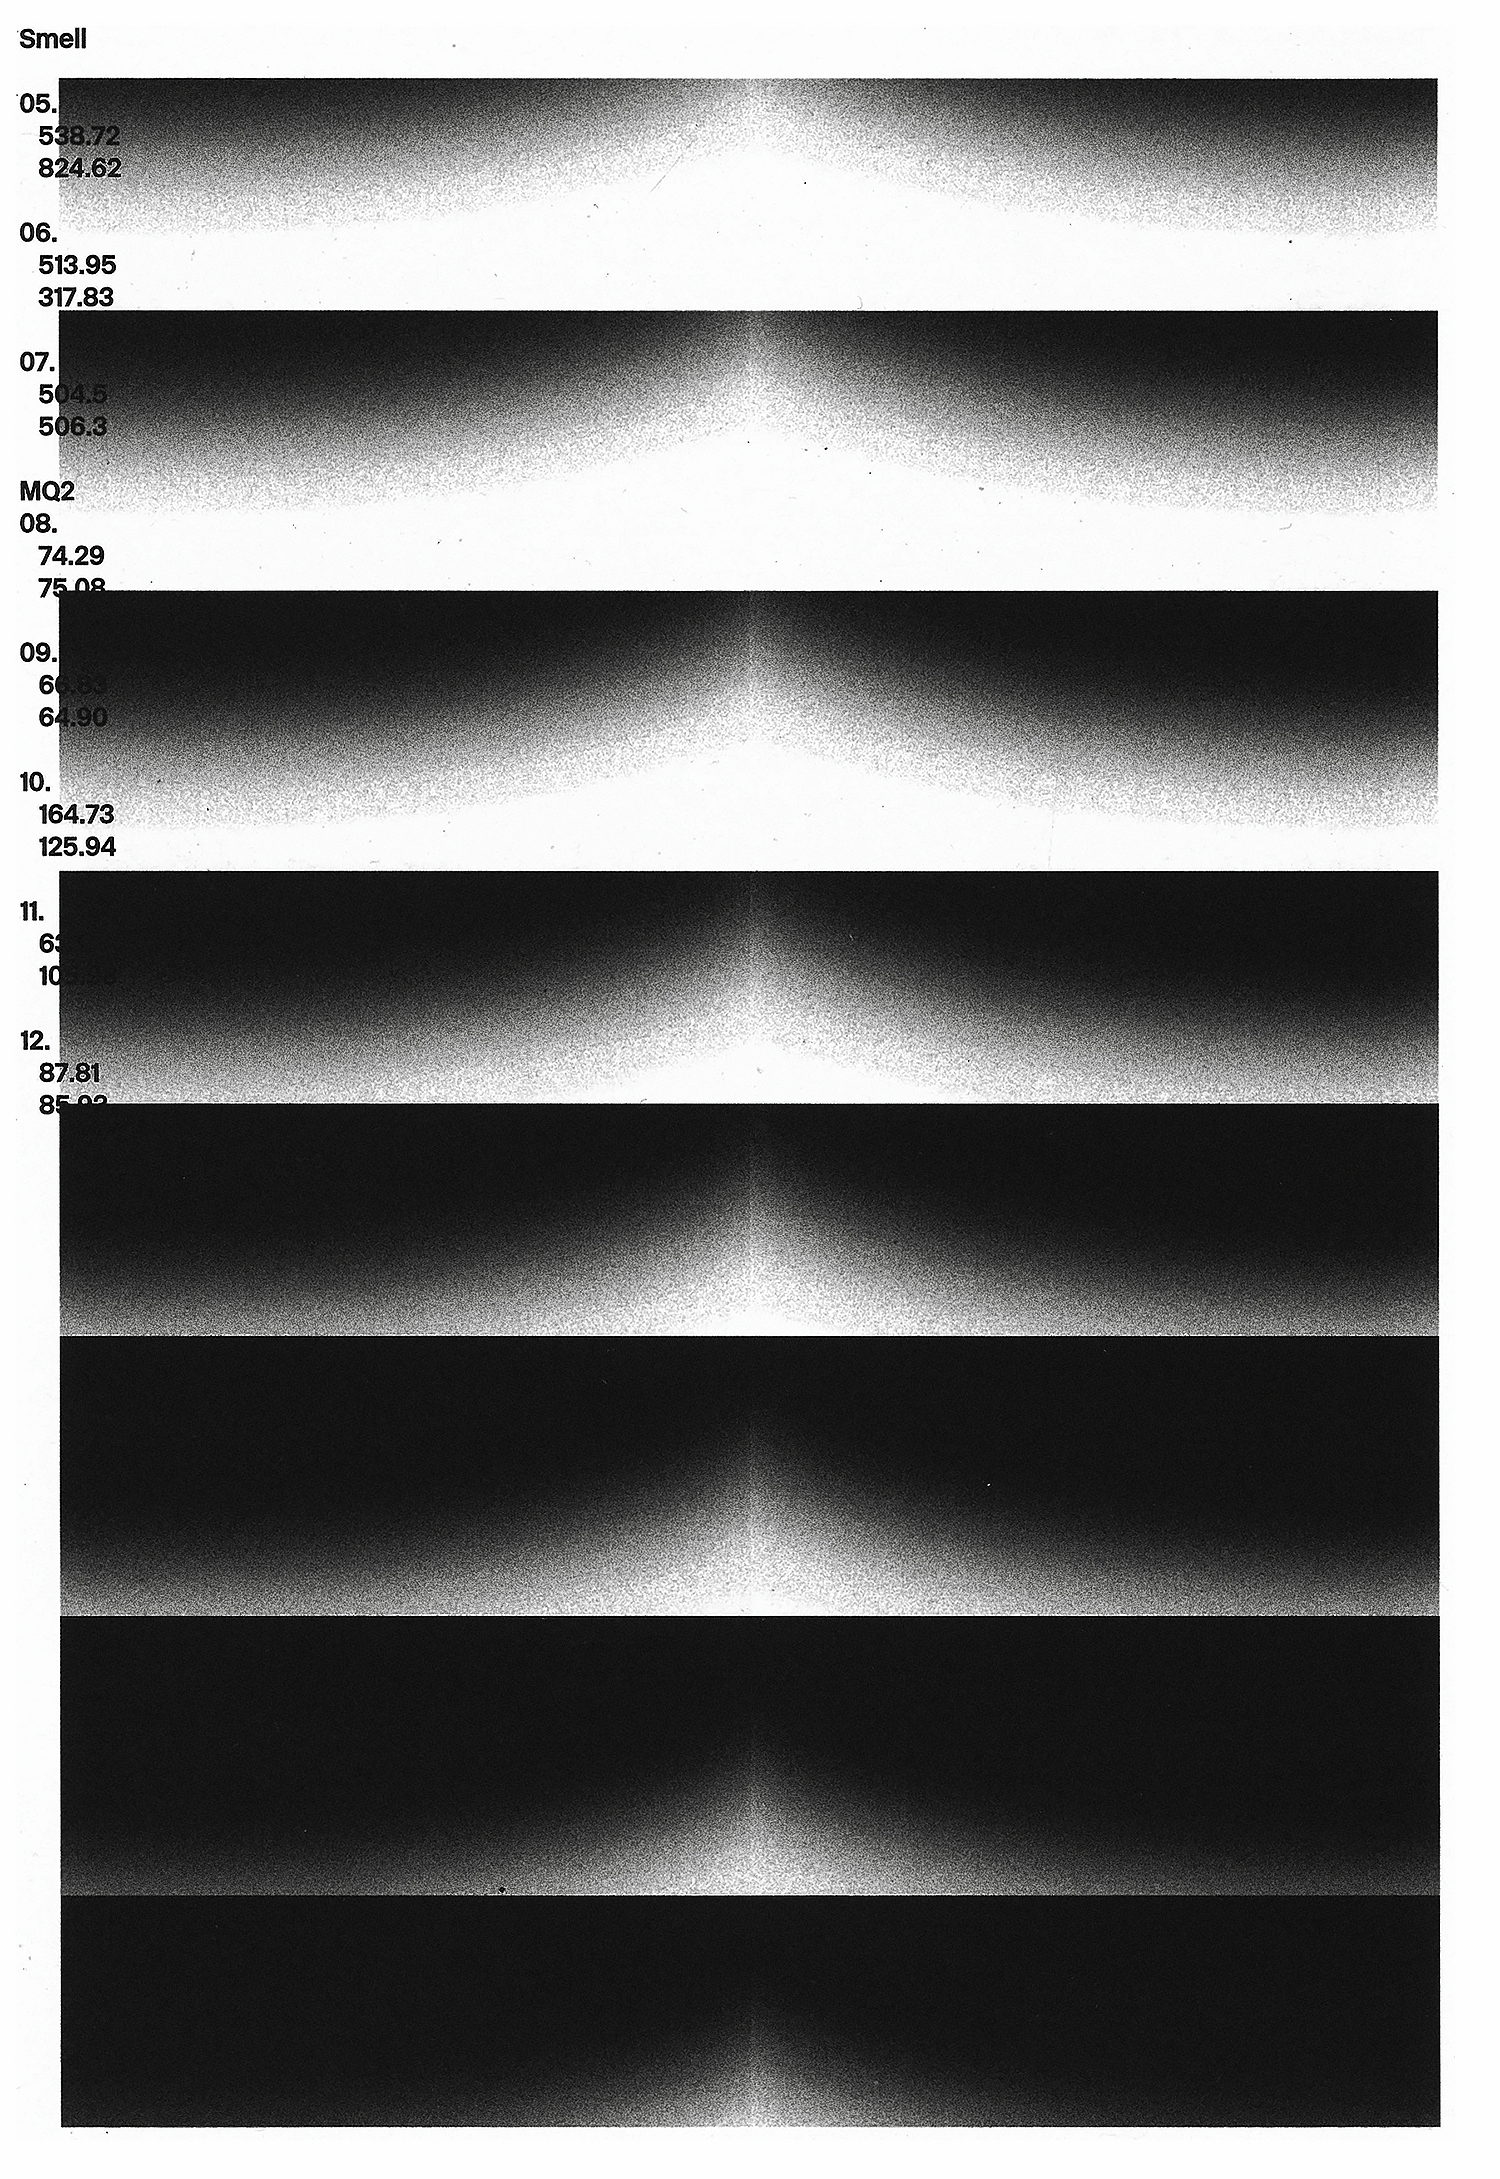
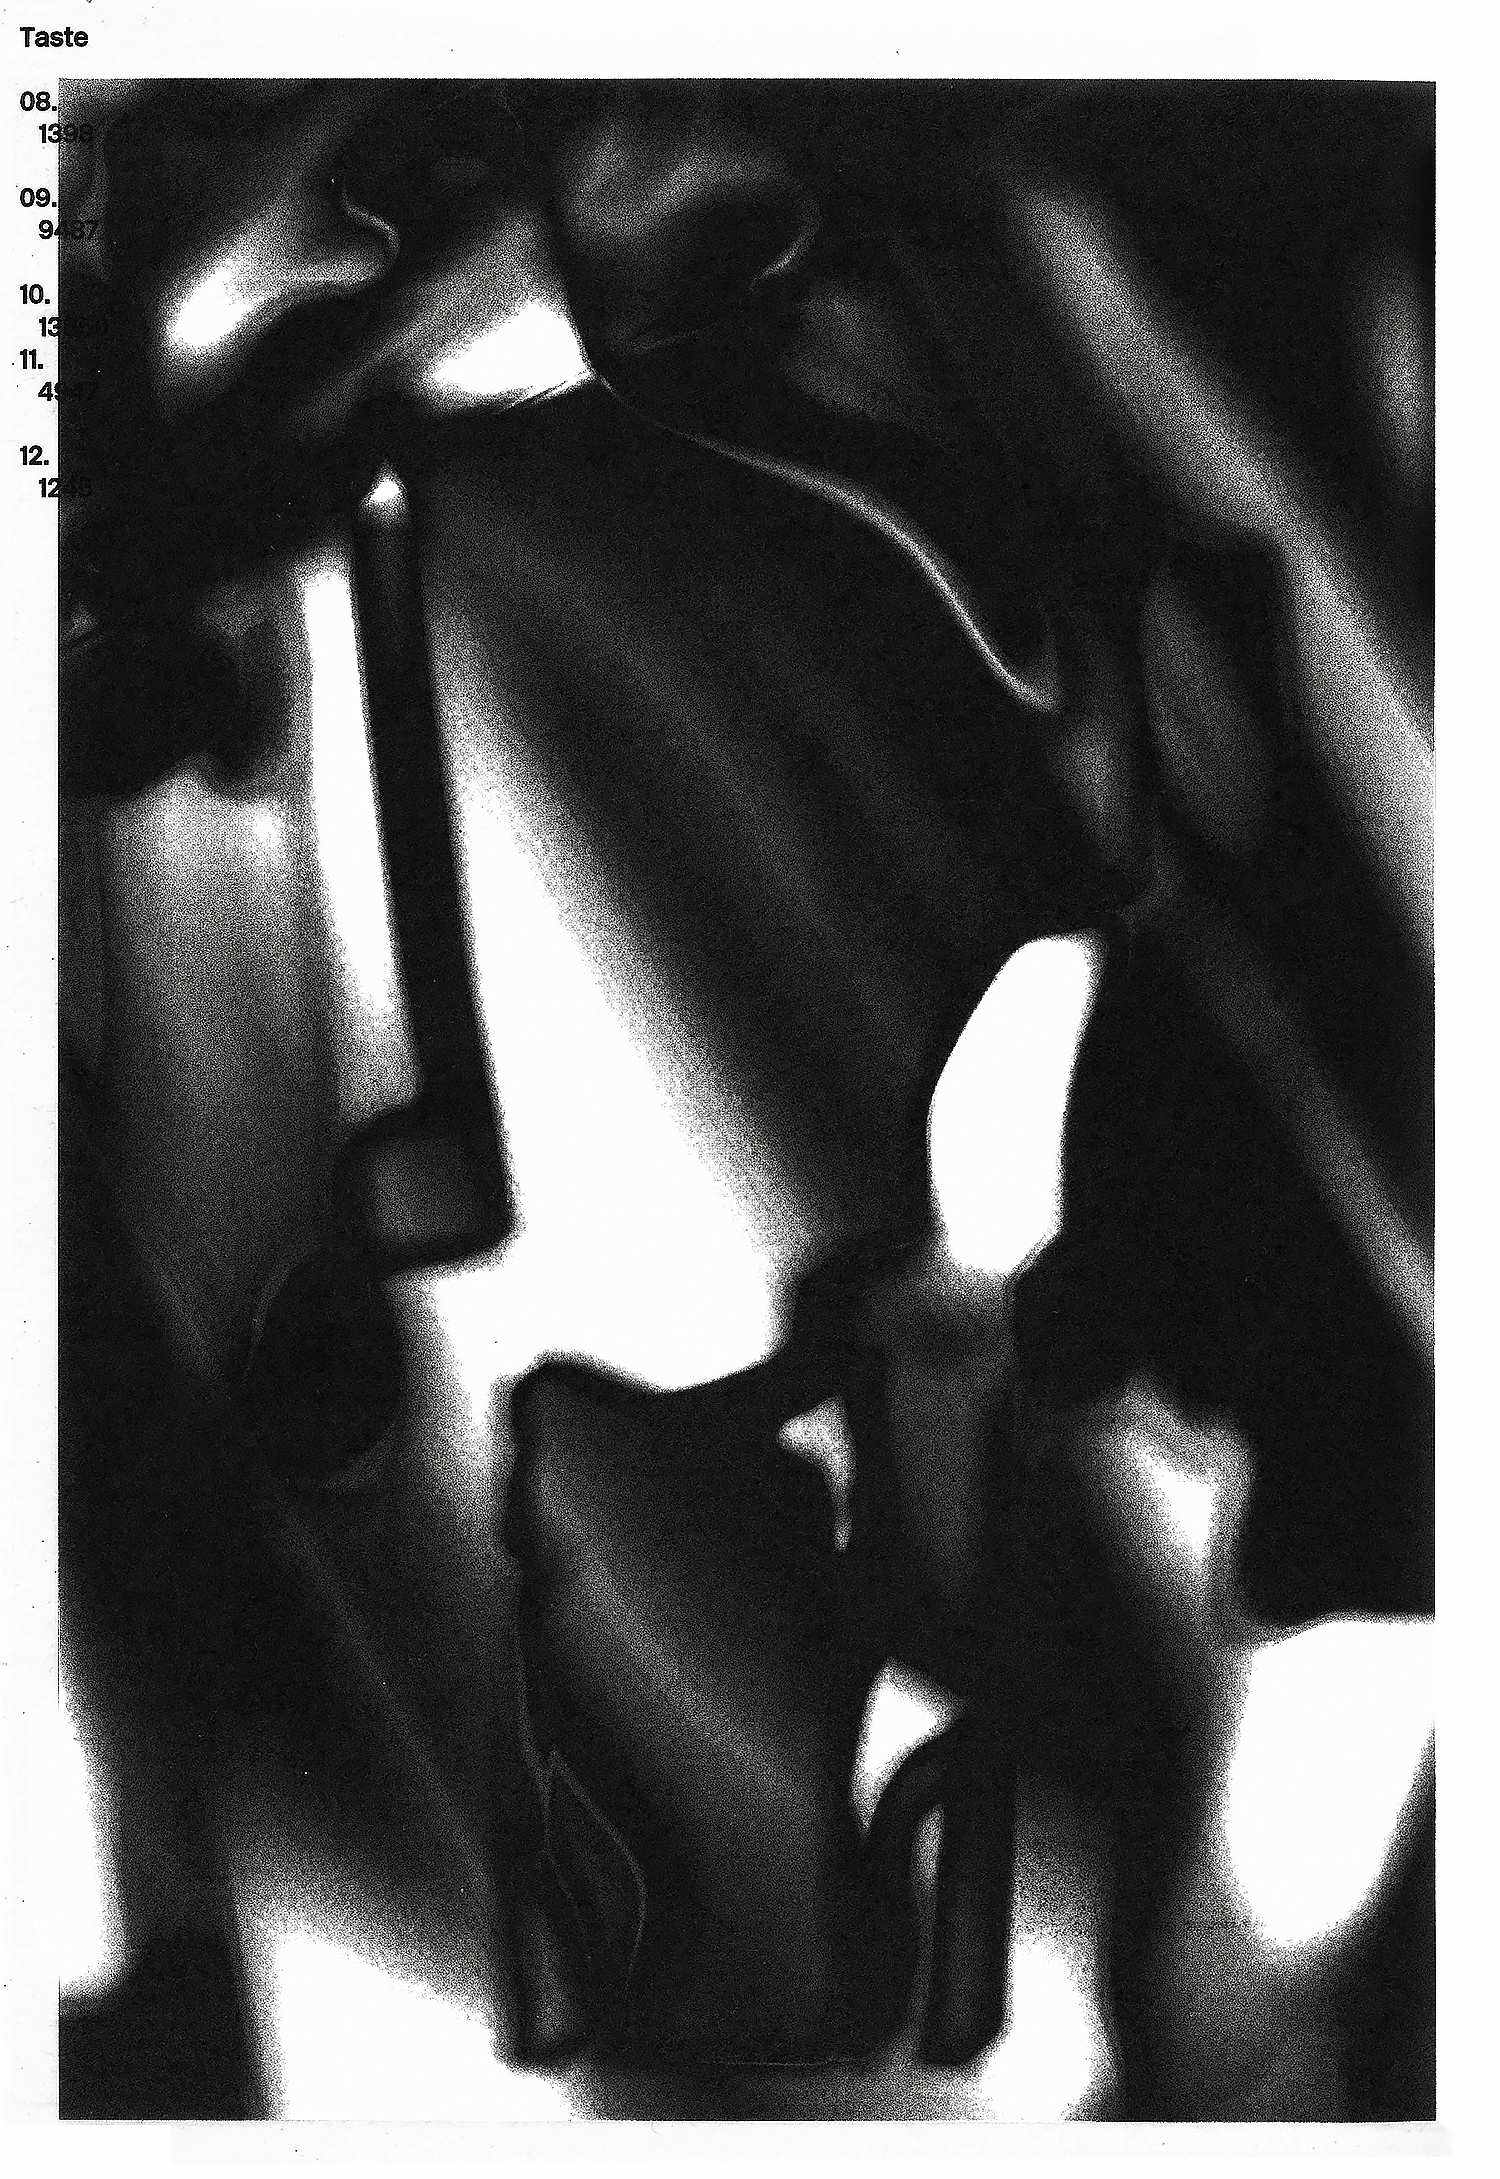
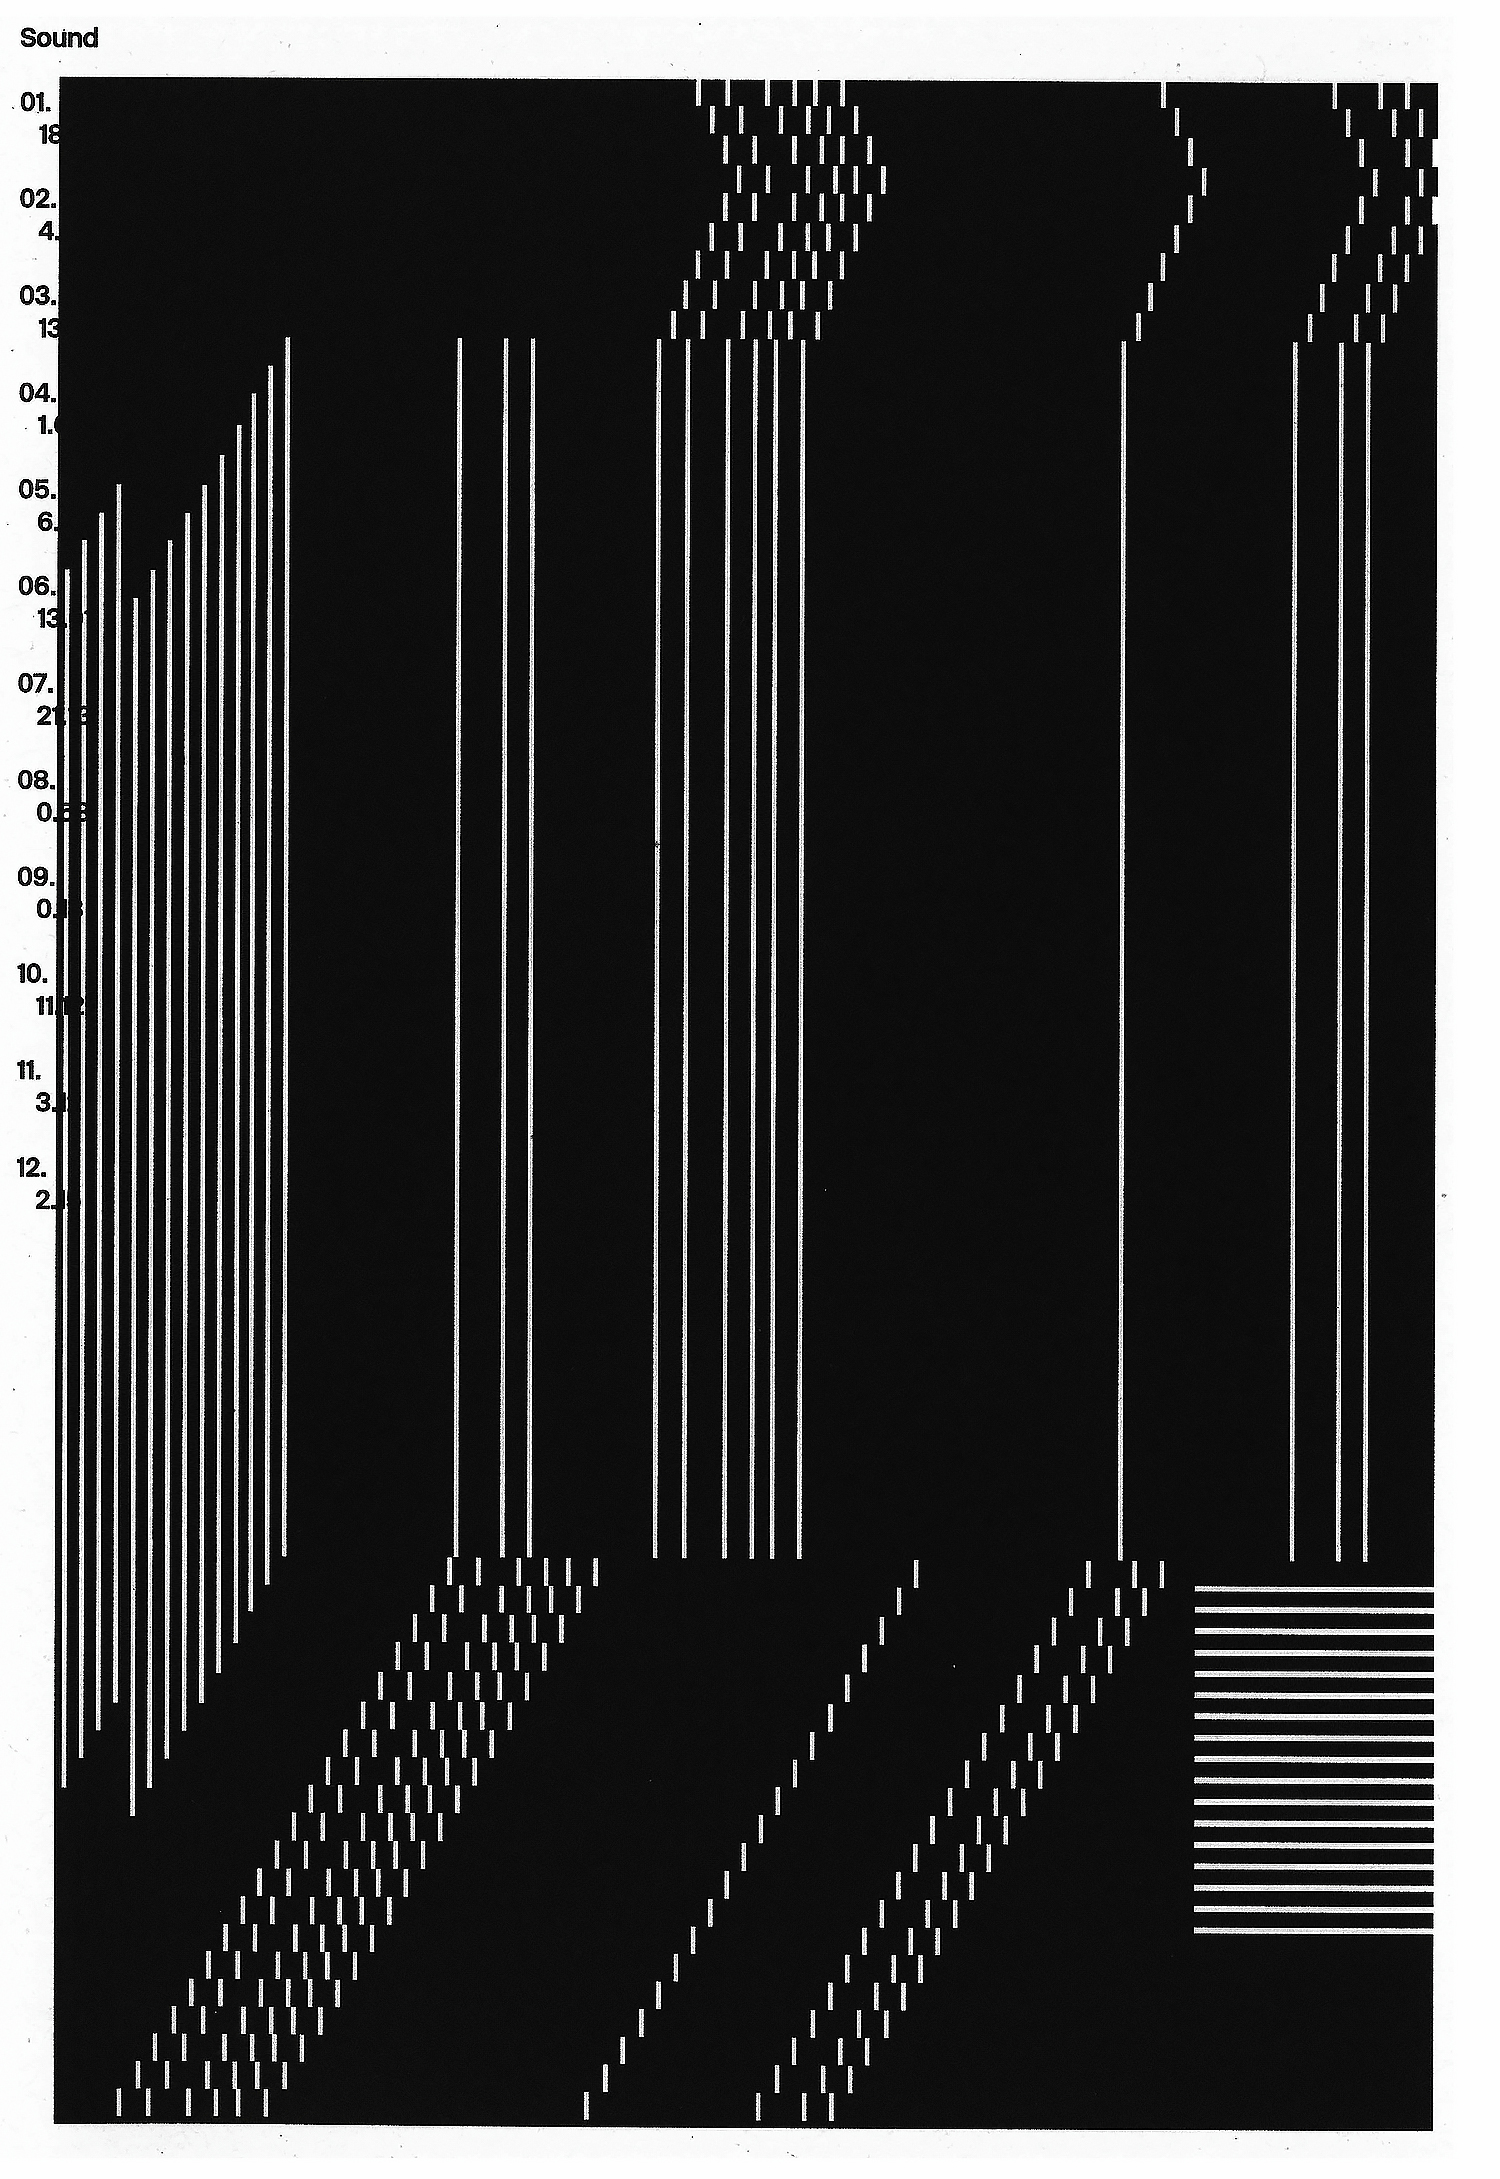
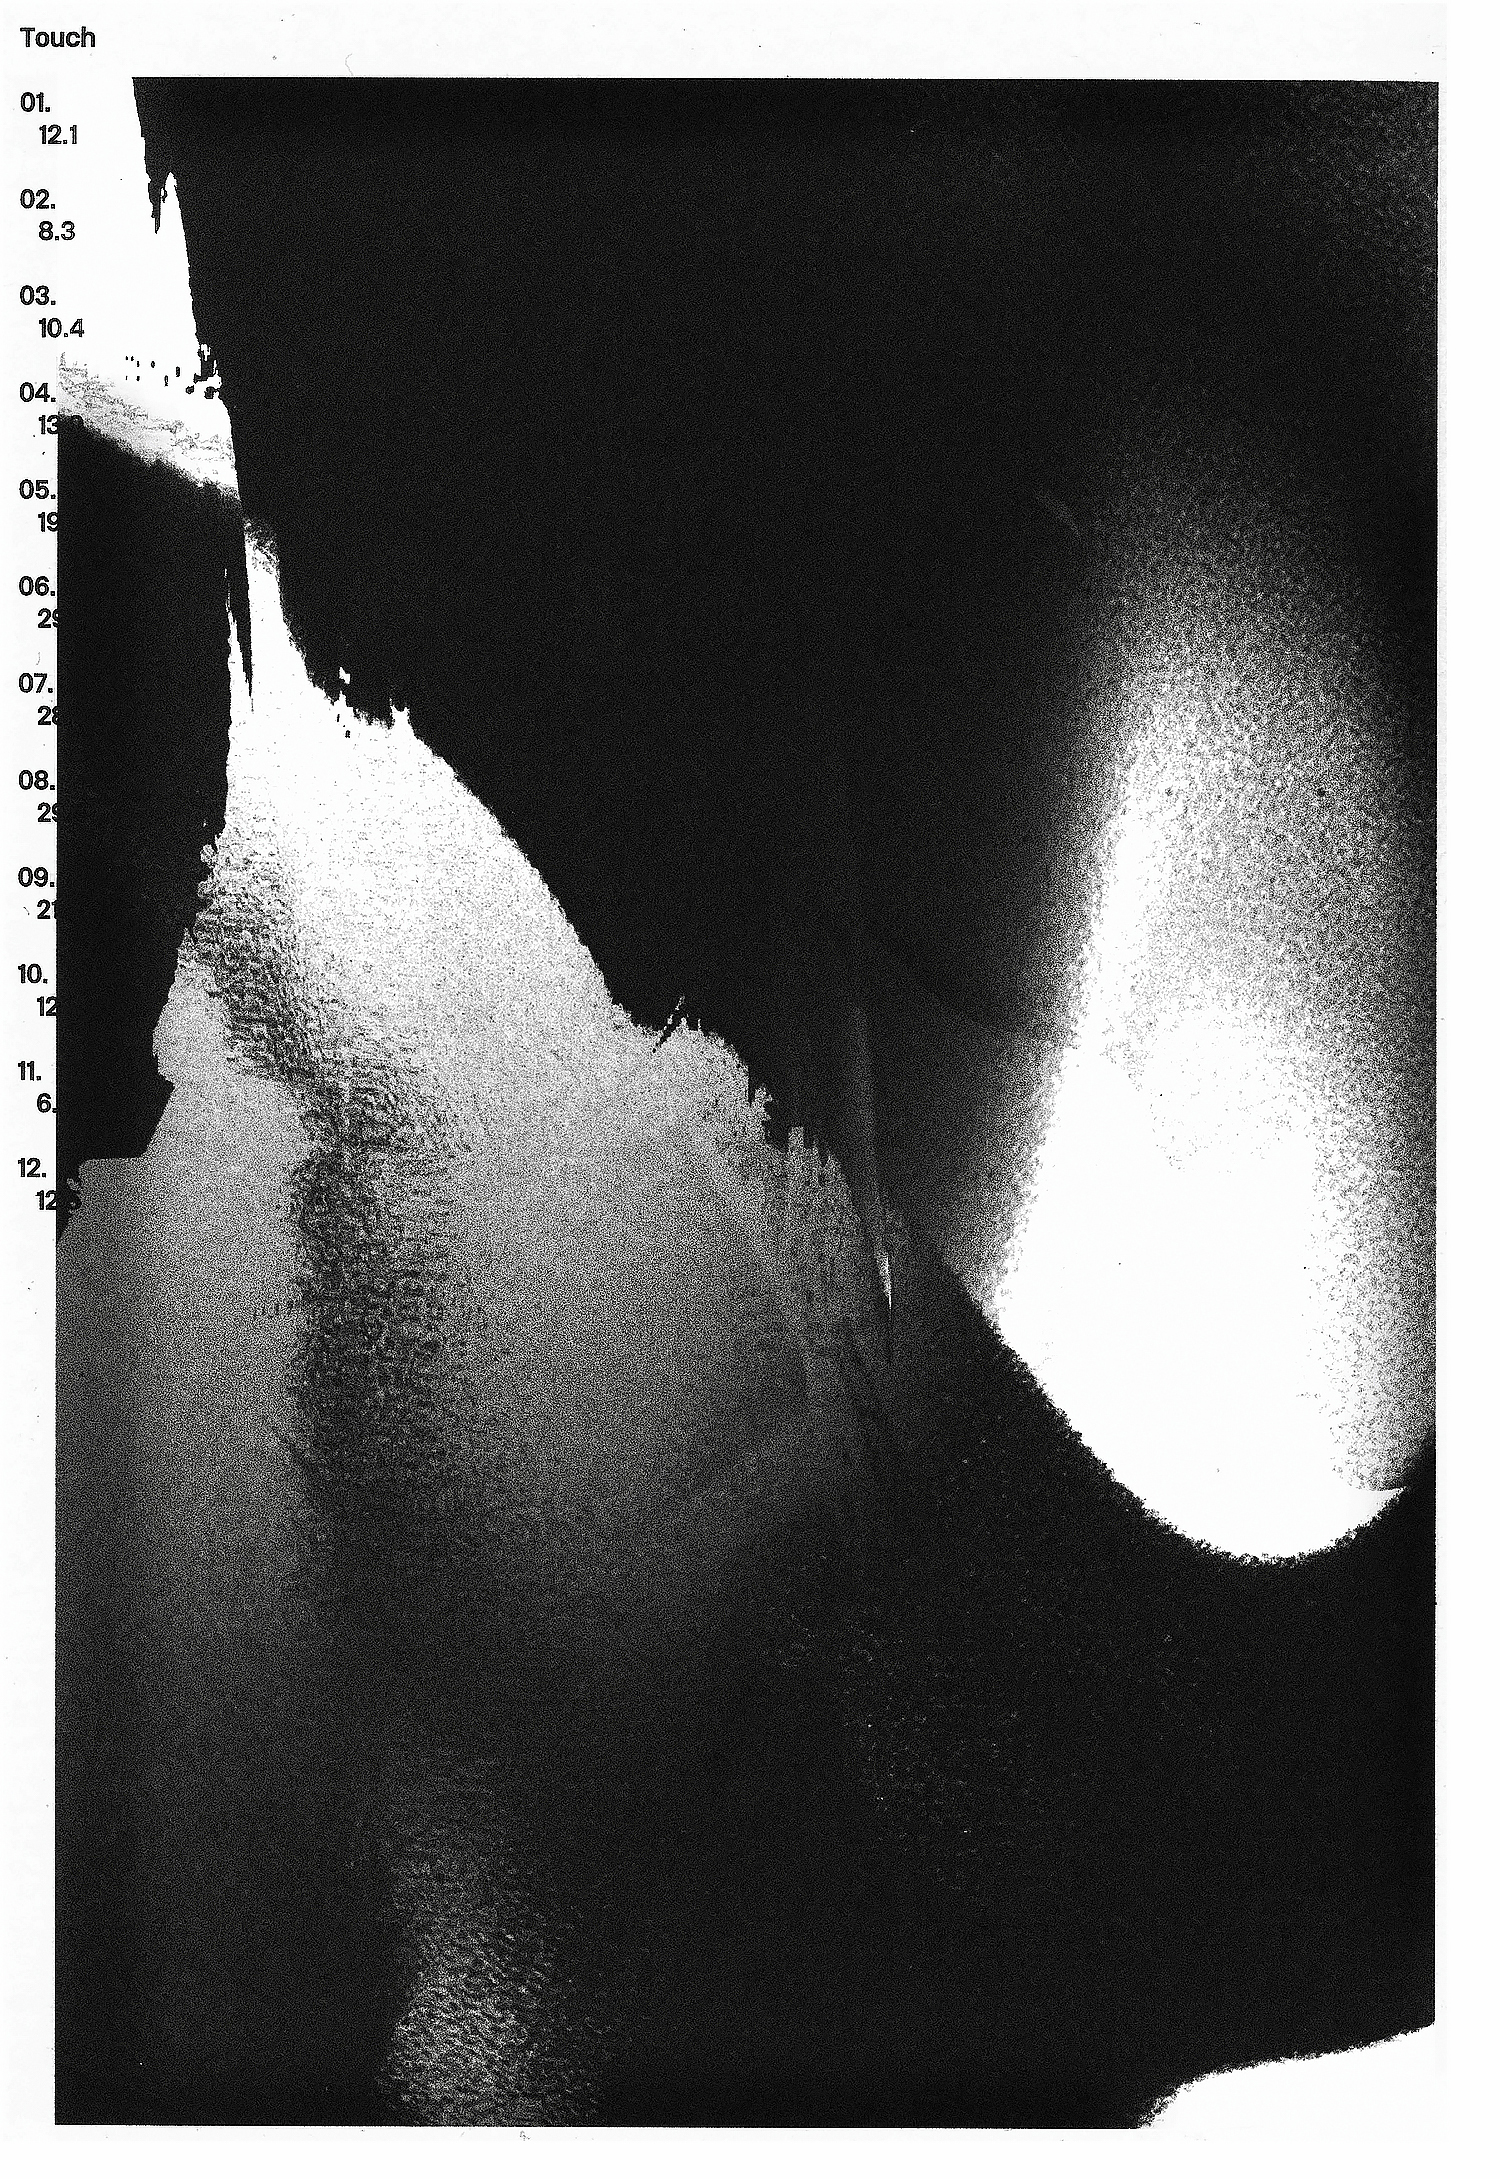
It is the hypochondria, the thrill to belong and the drive to let go. The terrain, the arrogance to let it go and still flow along. It is the sunset and how it feels warm. No more than the temperature to meet the touch. Nothing else than the light to make us aware of sight. What does dust taste like? It is the long drive, the longest walk that in the end has a sound average lingering in its memories. It is the smell, the barometer, the gas, it is that city and the lack of its society in numbers. Data Walking is an allegory to the senses. How can one evoke the 5 senses via a series of generative graphics with emotive goals, while being true to the average numbers of each sensor in its respective month? Interpolating data with how it feels to be human, the abstract flows, per month and per sensor:
Smell — Gas | Sound — Sound Average | Taste — Dust | Touch — Temperature | Sight — Light
Year: 2018
Client: Ravensbourne Research Office
Project by: David Hunter
Production: Aspect Press
Collaborators: Non-Verbal Club, João Novais
Client: Ravensbourne Research Office
Project by: David Hunter
Production: Aspect Press
Collaborators: Non-Verbal Club, João Novais
It is the hypochondria, the thrill to belong and the drive to let go. The terrain, the arrogance to let it go and still flow along. It is the sunset and how it feels warm. No more than the temperature to meet the touch. Nothing else than the light to make us aware of sight. What does dust taste like? It is the long drive, the longest walk that in the end has a sound average lingering in its memories. It is the smell, the barometer, the gas, it is that city and the lack of its society in numbers. Data Walking is an allegory to the senses. How can one evoke the 5 senses via a series of generative graphics with emotive goals, while being true to the average numbers of each sensor in its respective month? Interpolating data with how it feels to be human, the abstract flows, per month and per sensor:
Smell — Gas | Sound — Sound Average | Taste — Dust | Touch — Temperature | Sight — Light
Smell — Gas | Sound — Sound Average | Taste — Dust | Touch — Temperature | Sight — Light
*These pages have been designed together and along with the great Miguel Almeida and João Novais.


